
How to Build an Effective Product Analytics Framework
You know the moment. You are a few slides into a leadership review when someone asks whether last quarter's work actually moved the business, and the data you need sits scattered across an analytics tool, a spreadsheet, a survey export, and a few Slack threads. In 2026 that question lands harder, because capital is expensive and your CEO and CFO are scrutinizing every roadmap bet for its return. A product analytics framework is what removes that exposure: a structured way to choose, organize, and interpret the metrics that prove your product is creating value, so your data leads to decisions instead of stopping at dashboards.
The rest of this guide covers what belongs in a framework, how to choose and connect the right metrics, how to pair them with the customer context that explains them, and how to translate it all into the language your executive team rewards.
Key Takeaways
- A product analytics framework is a structured approach to selecting, organizing, and interpreting product metrics so they answer the questions leaders actually ask, turning scattered data into confident decisions about what to build next.
- The most useful frameworks tie every metric to a decision, so a number only earns a place on the dashboard when someone would act differently depending on which way it moves.
- Quantitative trends tell you what is happening and how much, while qualitative signal explains why, and pairing the two is what turns numbers into understanding.
- In ProductPlan's 2026 State of Product Management report, product leaders rate their confidence in measuring business impact at just 3 out of 5, and a clear framework is what closes that gap.
- When your analytics and your synthesized customer signal sit in one connected view, evidence reaches the roadmap instead of getting lost between tools.
- With executives demanding proof that spending pays off, the frameworks that win translate product metrics into outcomes a CFO recognizes, such as revenue, retention of value, and payback, rather than activity counts.
What is a product analytics framework?
A product analytics framework is a structured approach to choosing, organizing, and interpreting product metrics so they answer real business questions. It connects each number to a decision, turning a pile of data into a clear story about what your product is doing for customers and for the business.
The word framework matters. Most teams have no shortage of data, yet a framework starts from the questions you need to answer and works backward to the smallest set of metrics that answer them.
That discipline is rare. In ProductPlan's 2026 State of Product Management report, only 5.7 percent of teams use structured prioritization frameworks such as OKRs or scoring models, so most product decisions are still made reactively rather than from a defined system.
What metrics belong in a product analytics framework, and how do you choose them?
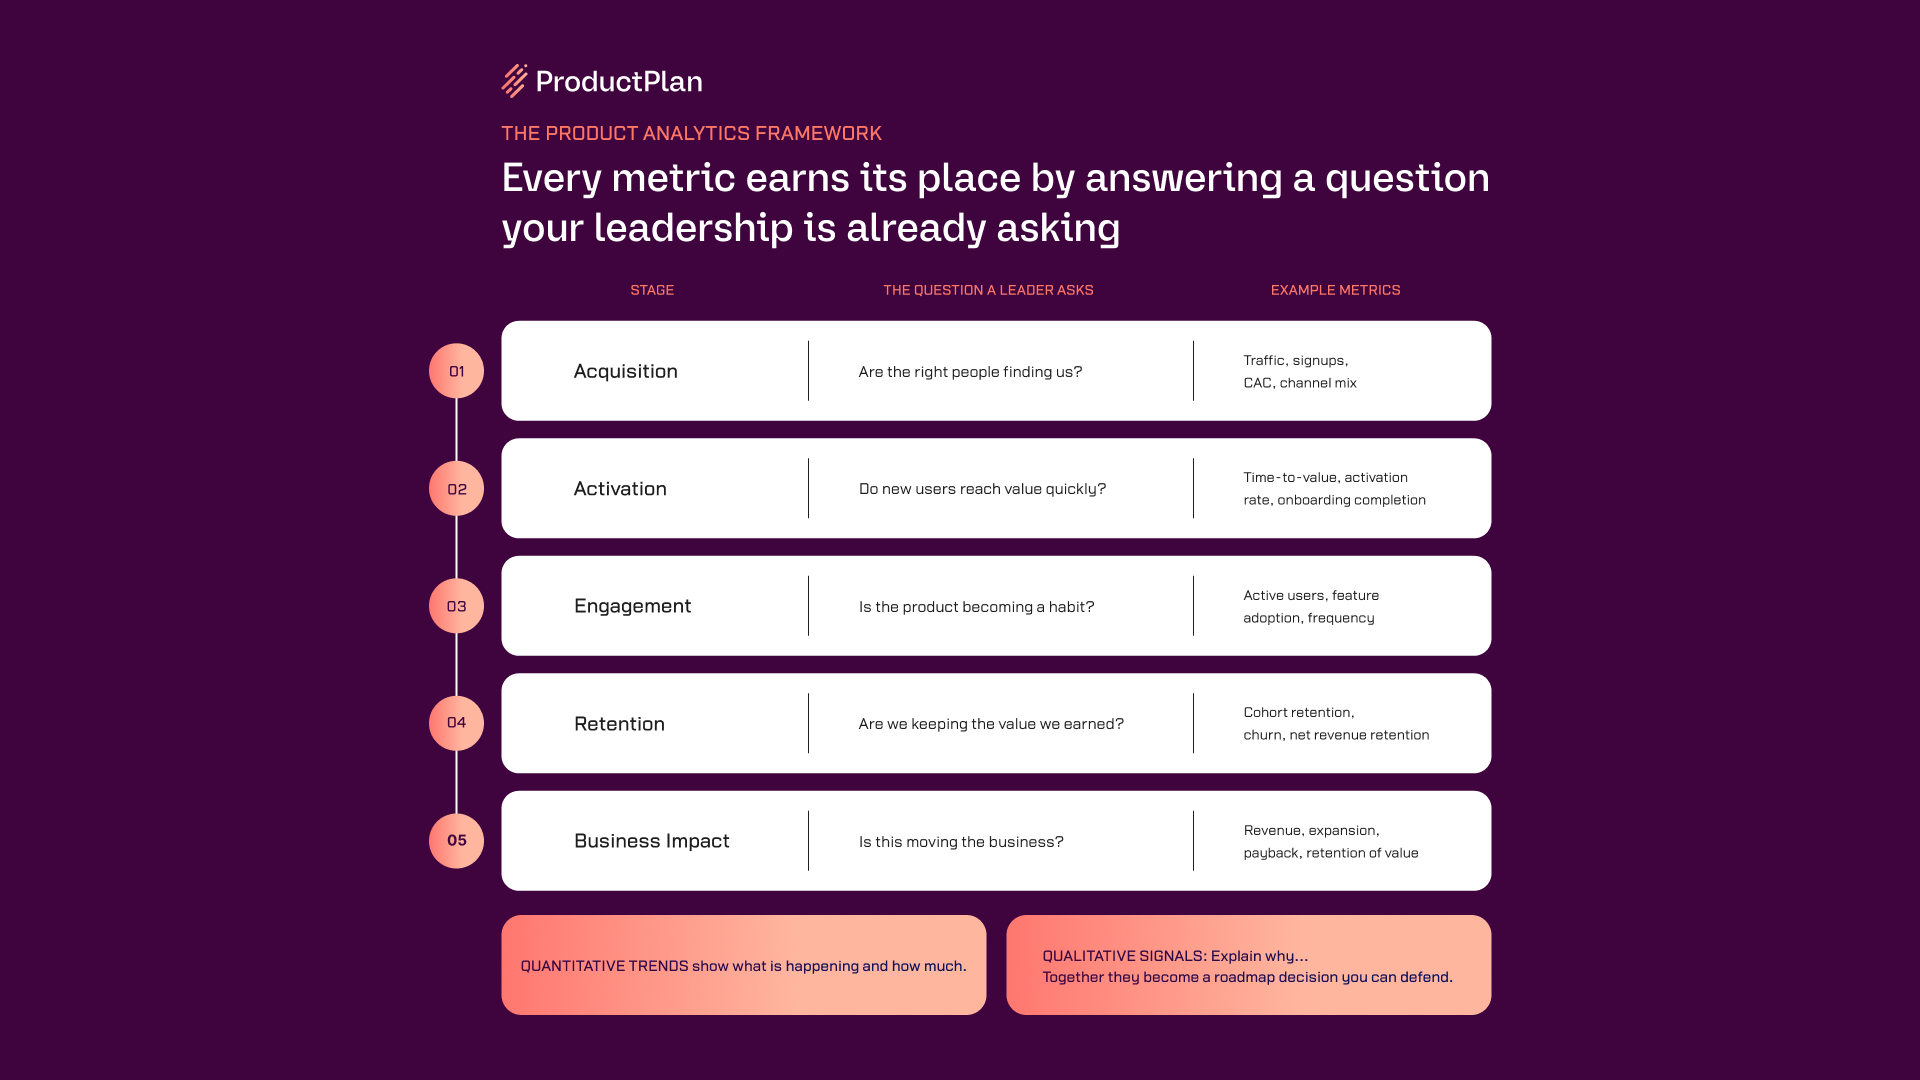
A good framework includes acquisition, activation, engagement, retention, and business impact metrics, chosen to match the questions your leadership asks. The selection test is simple: keep a metric only if a leader would make a different decision depending on how it moves, and set aside anything you track out of habit.
Organizing your metrics by stage keeps the picture honest, because each stage answers a different question and a healthy product needs all of them. The table below maps each stage to the question it answers and the metrics that tend to fit.

Retention deserves particular attention, because it is where teams discover whether the value they think they deliver is real. Growth advisor Elena Verna, now head of growth at Lovable, puts it plainly in her 2025 writing that "retention is the ultimate test of product-market fit." She adds a point worth carrying into your framework: weak retention is often a symptom of poor activation, so a churn number you cannot explain usually sends you back up the funnel to where new users were meant to find their footing.
How do you connect product metrics to decisions?
You connect metrics to decisions by treating every metric as the start of a question rather than the end of a report. For each one, agree in advance what a meaningful move looks like, which decision it would trigger, and who owns the response. A metric with no decision attached to it is a metric you can safely retire.
This connection matters more in 2026, because the hard part of product work has moved. As AI accelerates how quickly teams can build, the constraint shifts toward deciding what is worth building at all. Lenny Rachitsky, highlighting a point from Andrew Ng, framed it this way in his newsletter: "product management is becoming the new bottleneck." When shipping is cheap and the real scarcity is good judgment about what to ship, a framework that ties every metric to a decision becomes the leverage a product leader needs most.
The strongest frameworks trace a line from a product-level metric up to the business outcome it influences. Product leader Aakash Gupta calls this impact modeling: connecting a product metric through to revenue and profit so the expected return of a bet is clear before the team commits. When your framework makes that line visible, prioritization gets easier, because you are comparing the likely business impact of options rather than debating opinions.
How do quantitative and qualitative data work together?
Quantitative data and qualitative signal answer different halves of the same question. The numbers tell you what is happening and how much, and the customer context tells you why, so a drop in activation becomes actionable only once you understand the friction behind it. Reading them together is what separates understanding from guesswork.
This pairing is well established in measurement practice. The Nielsen Norman Group describes mixed-methods research as combining quantitative and qualitative data for a fuller picture, with the quantitative side anchoring benchmarks and the qualitative side guiding what to change. Yet teams often skip the harder half. In NN/g's research on quantitative practice, only about a quarter plan how they will judge success using both, which leaves most interpreting numbers without the context that explains them.
The point holds even as AI gets faster at producing the numbers. Product leader Melissa Perri, author of Escaping the Build Trap, captured the limit when she watched AI write a flawless product requirements document in seconds and noticed that "it just didn't know why it mattered." A model can surface patterns at speed, and the judgment about what they mean for real customers still belongs to your team. That judgment is the qualitative half of the framework, and it keeps your numbers honest.
This is where many teams feel the most pain, because the tools are scattered. In ProductPlan's 2026 research, 40 percent of teams say their strategy, discovery, roadmaps, and launch plans live across multiple tools with limited or no integration, and only about 22 percent have everything in one system. When the numbers live in one place and the customer quotes live in another, the why never quite reaches the decision.
ProductPlan closes that gap. As a Product Intelligence Platform, it brings your quantitative view together with synthesized customer signal in one workspace, and Winware AI turns the unstructured signal in sales calls, surveys, support tickets, and CRM notes into structured insight, with every recommendation traceable back to a real customer quote.
How do you prove product impact to your CEO and CFO?
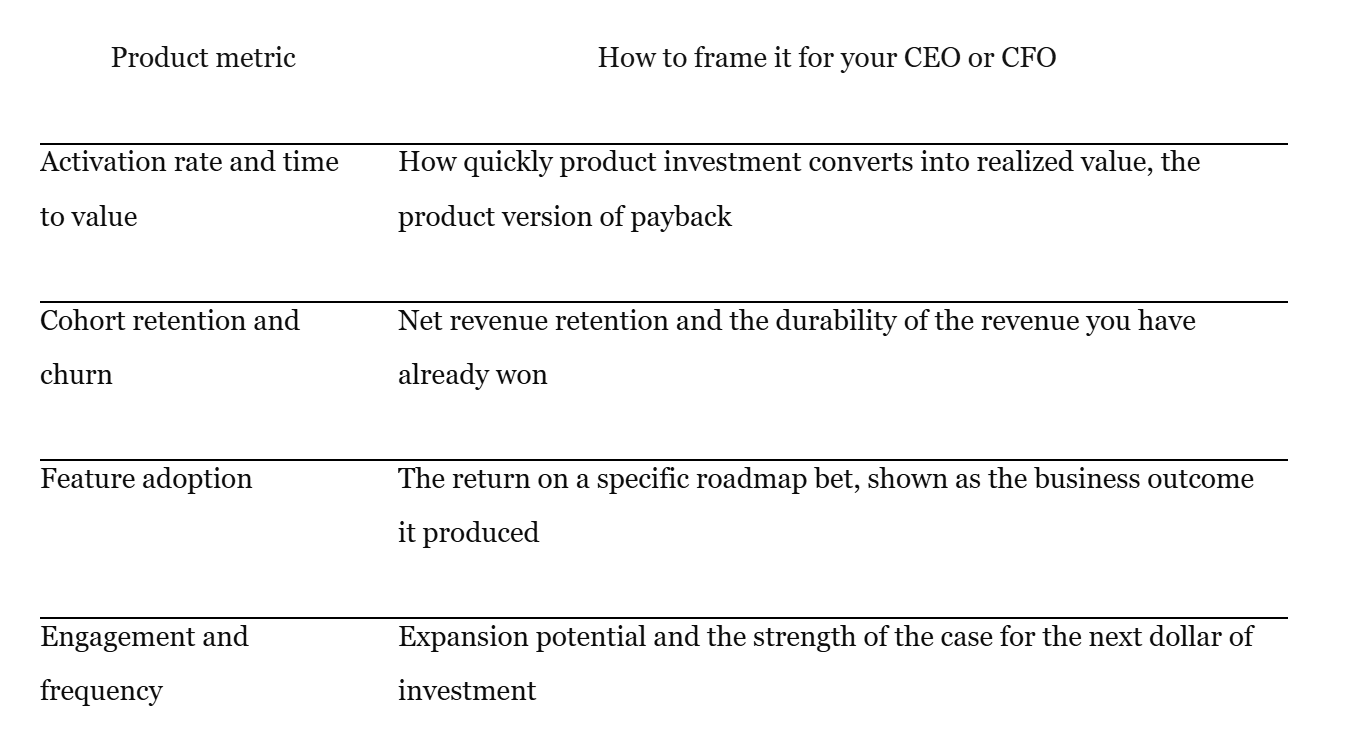
You prove product impact to executives by translating product metrics into the outcomes they manage: revenue, margin, retention of value, and payback. Lead with the business result, show the customer evidence underneath it, and tie each roadmap bet to a return your finance team can defend. The framework does the work, and the translation is what makes it land.
This matters because the people reviewing your roadmap are under real pressure in 2026. Capital is expensive, and executives are asking whether technology spend actually pays back, with good reason. In Deloitte's 2025 survey of more than 1,800 executives, only six percent saw their AI investments pay back in under a year, and even among the most successful projects just thirteen percent saw a return within twelve months, with most expecting two to four years. As your team ships more AI-assisted features, that skepticism arrives at your door, and a framework that proves whether a feature moved a business number is how you answer it.
The fix is to measure outputs, not activity. A dashboard of time saved, features shipped, and rising registration totals describes effort, yet it rarely tells a CFO whether the business is better off. Tie your metrics to revenue, expansion, and retained value, and the same framework that guides your team also speaks the language executives use to allocate capital. Traceability is the other half of credibility: a claim that traces back to a real customer quote is far easier to defend in a board review than a number with no story behind it, which is why audit-ready evidence has become the standard finance teams reward.
The table below translates common product metrics into the terms your leadership already uses.
Is a formal product analytics framework right for your team right now?
A framework is worth formalizing when decisions get harder to defend and data gets harder to find. If you can already answer leadership's questions quickly and confidently, a lighter set of metrics may be enough for now. The signals below help you place yourself.
A formal framework will help most when:
- Your metrics live across several tools, and assembling a clear picture takes hours.
- Your team tracks many metrics but rarely changes course based on any of them.
- You can see churn or slowing growth, yet you cannot explain why.
- Your own confidence in measuring business impact is low, a feeling product leaders share widely, averaging just 3 out of 5 in ProductPlan's 2026 report.
A lighter approach may be fine when:
- You are very early, still searching for product-market fit, and a few core signals tell you most of what you need.
- Your product is small enough that the whole team already shares the same view of the data.
What are the most common product analytics mistakes, and how do you avoid them?
The most common mistake is tracking many metrics without tying any of them to a decision, which produces busy dashboards that look informative but rarely change what the team does next. The fix is to start from the questions you need to answer and keep only the metrics that change an action when they move.
A second trap is leaning on vanity metrics, the totals that always rise and so never prompt a decision. Total registered users feels reassuring, yet it says little about whether people are finding value, so pair it with activation and retention to see the fuller story. A third is letting your data stay scattered, which quietly taxes every analysis and makes the why hard to reach, so bringing your quantitative metrics and qualitative signal into one connected view keeps the framework usable week to week.
Frequently asked questions
What is a product analytics framework?
It is a structured approach to selecting, organizing, and interpreting product metrics so they answer real business questions. By connecting each metric to a decision, it turns scattered data into clear choices about what to build, fix, or invest in next.
What metrics should a product analytics framework include?
It should include acquisition, activation, engagement, retention, and business impact metrics, chosen to match the questions leadership asks. The goal is the smallest set of metrics that answer those questions well, rather than every metric a tool can produce.
How do quantitative and qualitative data work together in product analytics?
Quantitative data shows what is happening and how much, and qualitative signal explains why it is happening. Pairing them produces understanding that neither one offers alone, which is why mixed methods are a long-standing best practice in measurement.
How often should you revisit your product analytics framework?
Review it on a regular cadence, often quarterly, and any time the product or market shifts meaningfully. Retire metrics that no longer drive decisions and add ones that better explain current behavior, so the framework stays useful as conditions change.
Build a framework your roadmap can stand on
The product leaders who walk into a review with confidence are not the ones with the most dashboards. They are the ones whose metrics connect cleanly to decisions, and whose numbers come with the customer context that explains them. A framework gives you that clarity, and it gets far easier to maintain when your evidence and your plan live in the same place.
That is what ProductPlan is built to do, uniting your quantitative metrics with synthesized customer signal so every priority traces back to real evidence your team can defend.
Book a demo to see how a connected Product Intelligence Platform turns your scattered data into decisions you can stand behind.
Related reading
- Quantitative versus qualitative data in product decisions
- What product intelligence means for modern product teams
- The ultimate guide to product management prioritization frameworks
- 5 metrics every product manager should know
Sources
- ProductPlan, 2026 State of Product Management report (proprietary data: confidence in measuring business impact, framework adoption, tool fragmentation; produced in partnership with the Product Led Alliance).
- Elena Verna, "Retention: The situationship of SaaS," elenaverna.com, June 2025.
- Aakash Gupta, "The 2025 Product Strategy Playbook," news.aakashg.com, March 2025.
- Lenny Rachitsky, highlighting Andrew Ng on product management as the new bottleneck, Lenny's Newsletter, 2025.
- Melissa Perri, on the limits of AI in product judgment, LinkedIn, 2025.
- Deloitte, "AI ROI: The Paradox of Rising Investment and Elusive Returns," deloitte.com, October 2025 (AI payback timelines).
- Nielsen Norman Group, "What is Mixed-Methods Research?" and "Quantitative UX Research in Practice," nngroup.com.
Ready to build with confidence?


.svg)