How to Use the Kano Model to Prioritize Features

How can product managers use the Kano Model to prioritize their roadmaps? Kano Model feature prioritization typically consists of three main steps: research, analyze, decide. We'll break them down step by step in this article.
Step 1: Research (conduct a Kano Study)
The first step is designing and running a Kano study. This is your opportunity to collect valuable Voice of Customer (VoC) information about the features you want to prioritize. It's advised to ask two questions for each feature or initiative.
- A functional or positive question. This explores how they would feel WITH said feature.
- A dysfunctional or negative question. Explores how they would feel WITHOUT said feature.
Rather than leaving the answers to these questions open-ended, you want to have respondents use a scale. This makes the next step (analyzing the data) easier.Liz Milliken of SurveyGizmo suggests a five-point scale for Kano study responses:
- Like it
- Expect it
- Don't care
- Live with
- Dislike
In addition, many experienced Kano Model users suggest adding a third question: Importance: How important is X feature? (You can use a five- or seven-point Likert scale for responses to the importance question.)
As for how many people to include in your Kano study, that's largely up to you. Jan Moorman, Principal Design Researcher for projekt202, says her team's magic Kano study size is somewhere between 12 and 24 customers."The goal is to include enough users to perceive differences with statistical confidence. The number of users required to accomplish this goal depends on two key factors: The diversity of the people included in the study and the granularity of differences you are attempting to measure," she explains.A few other considerations when selecting participants and study size:
- Will you later want to break down responses by personas? If so, you should ensure you have enough representation for each persona you'd like to look at.
- Are there any other customer data points you'd like to segment the results by? (For example, NPS score, industry, account size, etc.) If so, make sure you select your sample carefully.Download the Product Roadmap Kit ➜
Step 2: Analyze the results of your Kano Study
The next step is to analyze the data you've collected from your user surveys or questionnaires. As Daniel Zacarias explains, you can take two different approaches to analyzing your Kano study results—discrete analysis or continuous analysis. (You can also use both.)For each type of analysis, you will use a table to record a set of scores for all potential features.
Discrete analysis
For many, this is the simplest method of analyzing Kano study data, but it is also the most superficial in terms of getting you to the answers you need.With a discrete analysis, you will simply divide respondents by their respective demographic or persona criteria, categorize each respondent's answers (which range from 1 to 9 for each question), and then add up the total responses in each category for each feature. The resulting table will look like this:

Continuous analysis
A much more rigorous method of analyzing your Kano study data is through continuous analysis.Using this approach, you will convert each respondent's answer to a score of "satisfaction potential" ranging from -2 to 4, and based on a scale of how much the respondent views the inclusion or exclusion of a feature as "functional" or "dysfunctional." (A higher dysfunctional score here actually means users desire the feature because they view its absence from the product as dysfunctional.)Conducting a continuous analysis of your data will often yield a much richer and more accurate view of what your customers value and want to see in your product. That table will look like this:

For more examples of tables for Kano study analysis, check out Daniel Zacarias's guide: How to analyze your Kano study results.
Step 3: Prioritize and make decisions
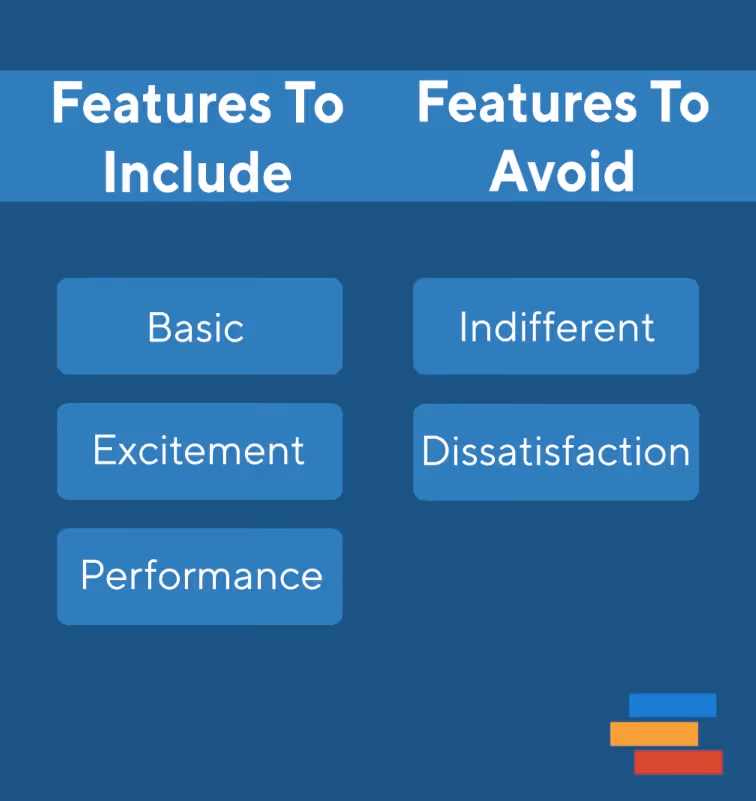
After you've determined what the data from your Kano study are telling you, you will have to decide how to respond to those answers.You probably won't have time or resources to implement all of the features your respondents have indicated they want. So how you should decide which ones make it onto the roadmap for immediate work, which get pushed out to a longer-term time horizon on the roadmap, and which you'll send back to the backlog for now?The proper strategy in most cases, according to Zacarias, is to prioritize all "Must-be" (basic) features first, then as many Performance features as possible, and then add some "Attractive" (customer delight) features if you can. (Need some inspiration? here are some examples of excitement features.)
Of course, you will also have to weigh additional factors specific to your product and your company. For example, these decisions will be affected by the current state of your product's development. If it's new, you might need to prioritize those basic threshold features, because if the market notices they are missing when you launch, you might not get another opportunity to reintroduce the product to your user personas.
Ready to build with confidence?

.svg)
.svg)