The SaaS Product Metrics Pyramid

Having a healthy appetite for information is a prerequisite for good product managers, but only if you know how to satiate this hunger the right way. Thanks to new technologies, we have an immense amount of data at our fingertips that we can use to inform our SaaS product decisions. But we need to prevent ourselves from overindulging! A healthy SaaS product metrics diet will help you cut out the junk and focus only on the metrics that truly matter to your product and product strategy.In this post, we’ll take a look at some of the most common SaaS product metrics for product managers, and walk through how you can use the SaaS product metrics pyramid to ensure you and your team stay on a healthy metric diet.
Common SaaS Product Metrics
There are countless metrics that may be of interest to SaaS product managers. But for the sake of simplicity, we can easily break them down into two main categories: business metrics and product metrics.
SaaS Business Metrics
Business metrics for SaaS products give you insight into marketing, sales, revenue, and growth. This category of high-level metrics is useful for indicating the health of your business and measuring progress toward greater business objectives.
Conversions
Conversions measure movement through a series of steps and can be applied and measured in several types of situations. To measure the effectiveness of a signup form, for example, you’d want to look at the number of people visiting the form versus the number of people who completed it. You can also look at conversions as they relate to different stages in your sales process (i.e. percentage of people who went from free trial users to paying customers).
Monthly Recurring Revenue (MRR)
Monthly recurring revenue or MRR is often considered “the holy grail of all SaaS metrics,” and for good reason; it tells you a lot about the health of your business overall. MRR is a measurement of what’s being brought in by month. We often look at it as it relates to a larger goal such as “we want to increase our MRR by X percent this quarter.” You can break down MRR into more specific segments to help further focus your efforts. New business MRR, expansion MRR, churned MRR (more on churn in a moment), and total MRR are all helpful segments to look at.
Customer Acquisition Cost (CAC)
Customer Acquisition Cost, or CAC, measures how much you’re spending to acquire new customers. It’s a good metric to use during growth phases to determine whether you are operating efficiently. If you want to add some context to CAC, you can also consider looking at months to recover CAC, which will tell you how long after you’ve brought on a new customer you “break-even” on your acquisition costs.
Lifetime Value (LTV)
Customer lifetime value (LTV) is a projection (read: estimate) of how much revenue accounts will bring in over their lifetime. Calculating LTV can be tricky, as there are several ways to approach it and you will have to pick the method most relative to your business. One reason you may look at LTV is if your business is shifting its focus toward larger enterprise accounts. In that situation, it may be useful to look at changes in average LTV over time to measure progress toward this objective. LTV, when used alongside an efficiency metric like CAC, can help you get a better grasp on how efficient your acquisition strategy is.
Churn
Churn is a metric all SaaS product managers need to know and understand inside and out. In short, churn measures people leaving. It’s a measurement of the percentage of accounts that cancel or choose not to renew their subscriptions with you. A high churn rate can negatively impact MRR and can also indicate dissatisfaction with your product or service. You can slice and dice churn metrics in many different ways—for example, you can look at MRR churn to see how much MRR you’re losing. You could also look at churn by type of account (for example, what percentage of logos are churning).
SaaS Product Metrics
Product metrics give you insight into your users, their behavior, and their habits in regards to your product and their overall satisfaction with it. These metrics are generally lower-level and more granular than business metrics but are still extremely important metrics for SaaS product managers.
Active Users (daily, weekly, or monthly)
Active users is a metric that could arguably fall into the business metrics category in the context of measuring growth because a serious increase in this metric can indicate an expansion in your market hold. Active users can also be a useful metric in understanding how many people are actually using your product. You should determine whether daily, weekly, or monthly active users is a more appropriate measure for your specific product. If you want to understand adoption and usage of a specific feature within your product, you can look at active users on a feature level as well.
Net Promoter Score (NPS)
Net promoter score is one of many types of customer satisfaction metrics with which SaaS product managers should familiarize themselves. NPS is a measure of your customers’ loyalty to your product and business and can be segmented by use case, location, size of the account, etc. You can use NPS to indicate which segments of customers are unhappy and therefore more likely to churn.
Usage and Behavioral Metrics
This extremely broad group of product metrics is specific to your product and therefore you’ll have to define them yourself. You may want to look at adoption of a feature, completion of a task or series of activities within your product, or even how much time users spend within your product. At ProductPlan we look a lot at how users are interacting with our product and see when they complete certain tasks such as creating a new roadmap, adding a bar to their roadmap, or adding an initiative to the Planning Board. Things like this give us a better sense of whether users are getting the most out of our product.
Download a Day in a Product Manager’s Life ➜
Trim the fat out of your metric intake with the SaaS product metrics pyramid
NPS, DAU, LTV, CAC, MRR? Those are just a few of the countless metrics relevant to SaaS product management. It’s safe to say we’re no longer trying to develop products in the absence of data. But we cannot let ourselves get swept away in the flood of data that’s out there.If you try and consider every single metric you have access to, you will soon find yourself drowning in data. Before that happens, you need to think critically about which metrics matter and define and document a manageable selection of key indicators on which to focus. How can we avoid drowning in data? We suggest adopting a strict SaaS product metrics diet using the product metric pyramid.
The product metric pyramid at a glance:
- At the top, you have your North Star. If you get lost you can always look at this metric for guidance.
- In the middle, you have metrics tied to the actions you are taking to influence your North Star.
- At the bottom, you have smaller, more granular bits of data that can help you troubleshoot problems and inform decisions for the initiatives on which you’re focused.
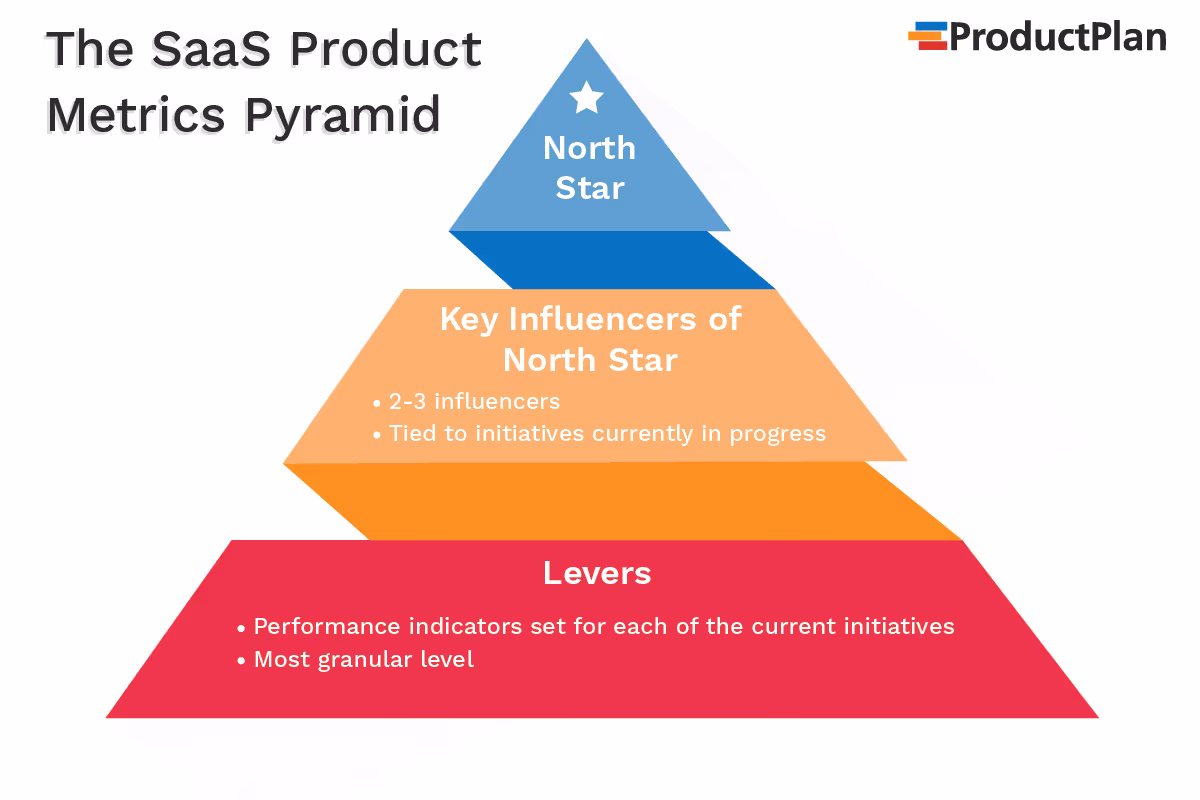
The “North Star” Metric
This high-level metric lives at the very top of our SaaS product metrics pyramid and is a guiding force for everything below it. Therefore, you should always define this metric first. You want your North Star metric to reflect organization-wide objectives and to align with the main concerns of the executive team. Ideally, you’ll tie a specific goal to this metric to contextualize it and make it easier to discuss at all-hands meetings. For example, a common North Star metric for SaaS products in a growth phase is new business MRR, which can easily be aligned with an organization-wide goal of “increase MRR by X percent quarter over quarter.”To determine your own north star metric, spend some time thinking critically about what matters most to the business right now. What do key stakeholders expect your team to help achieve at a high level? Once you’ve found your North Star, you can start to fill out the rest of your pyramid.
Key Influencers
Key influencers live just below the North Star on your pyramid. You want to define 2 or 3 key product metrics that have potential influence on your North Star AND are tied to initiatives on which your team is actively working. Remember, if you’re not actively taking steps to move the metric, it does not belong in your diet.To identify these, start by taking a look at the initiatives on your roadmap and how you can measure them in a way that is tied to your North Star. Look at the highest-level metrics your initiatives will move and place those under Key Influencers.For example, let’s say we are working on a set of changes and a new feature that we hope will prevent several high-paying, but unhappy customers from churning. We could look at Churn for those segments as a Key Influencer metric.
Levers
Levers are the most granular metrics, and there are more metrics in this category than in any other. Therefore, they belong at the base of the pyramid. This is the hardest category to narrow down because sometimes you need to go fairly far down the rabbit hole to answer your questions. Instead of trying to prescriptively list out every single metric, you might possibly want to look at, consider visualizing a dashboard of “vital signs” for each initiative you’re working on. What are the metrics that live there? These are your levers.Continuing our example from above, we could easily come up with several levers to consider such as:
- NPS score of relative segments
- Adoption of the new features by the segments we’re concerned about churning
- DAU/WAU/MAU numbers benchmarked against non-churning customers
This would give us a metric pyramid like the one below. If we have several active initiatives in a given moment, we could easily add sections to them in the pyramid in the same manner as we did for this one. Following this procedure, we force ourselves to think critically about which metrics truly matter, and which require less of our focus. It’s much easier to make sound decisions without all that extra noise, isn’t it?

The bottom line:
Whether you use our SaaS product metrics pyramid or one of the many other methods out there to define your key metrics, you’re making big strides toward streamlining your product management process. A focused, carefully defined set of key metrics will help you focus on important initiatives, communicate the “why” behind your actions, and avoid analysis paralysis.
Ready to build with confidence?

.svg)