RICE Scoring Model
What is the RICE Scoring Model for Prioritization?
The RICE scoring model is a prioritization framework designed to help product managers determine which products, features, and other initiatives to put on their roadmaps by scoring these items according to four factors. These factors, which form the acronym RICE, are reach, impact, confidence, and effort.Using a scoring model such as RICE can offer product teams a three-fold benefit. First, it can enable product managers to make better-informed decisions, minimize personal biases in decision making, and help them defend their priorities to other stakeholders such as the executive staff.We've broken down the framework in this short video below.
What's the History of the RICE Scoring Model?
Messaging-software maker Intercom developed the RICE roadmap prioritization model to improve its own internal decision-making processes.Although the company’s product team knew about and had used the many other prioritization models for product managers, they struggled to find a method that worked for Intercom’s unique set of competing project ideas.To address this challenge, the team developed its own scoring model based on four factors (reach, impact, confidence, and effort) and a formula for quantifying and combining them. This formula would then output a single score that could be applied consistently across even the most disparate types of ideas, giving the team an objective way to determine which initiatives to prioritize on their product roadmap.
How Does the RICE Scoring Model Work?
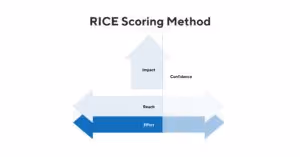
To use the RICE scoring model, you evaluate each of your competing ideas (new products, product extensions, features, etc.) by scoring them according to the following formula:
Reach
The first factor in determining your RICE score is to get a sense of how many people you estimate your initiative will reach in a given timeframe.You have to decide both what “reach” means in this context and the timeframe over which you want to measure it. You can choose any time period—one month, a quarter, etc.—and you can decide that reach will refer to the number of customer transactions, free-trial signups, or how many existing users try your new feature.Your reach score will be the number you’ve estimated. For example, if you expect your project will lead to 150 new customers within the next quarter, your reach score is 150. On the other hand, if you estimate your project will deliver 1,200 new prospects to your trial-download page within the next month, and that 30% of those prospects will sign up, your reach score is 360.
Impact
Impact can reflect a quantitative goal, such as how many new conversions for your project will result in when users encounter it, or a more qualitative objective such as increasing customer delight.Even when using a quantitative metric (“How many people who see this feature will buy the product?”), measuring impact will be difficult, because you won’t necessarily be able to isolate your new project as the primary reason (or even a reason at all) for why your users take action. If measuring the impact of a project after you’ve collected the data will be difficult, you can assume that estimating it beforehand will also be a challenge.Intercom developed a five-tiered scoring system for estimating a project’s impact:
- 3 = massive impact
- 2 = high impact
- 1 = medium impact
- .5 = low impact
- .25 = minimal impact
Confidence
The confidence component of your RICE score helps you control for projects in which your team has data to support one factor of your score but is relying more on intuition for another factor.For example, if you have data backing up your reach estimate but your impact score represents more of a gut feeling or anecdotal evidence, your confidence score will help account for this.As it did with impact, Intercom created a tiered set of discrete percentages to score confidence, so that its teams wouldn’t get stuck here trying to decide on an exact percentage number between 1 and 100. When determining your confidence score for a given project, your options are:
- 100% = high confidence
- 80% = medium confidence
- 50% = low confidence
If you arrive at a confidence score below 50%, consider it a “moonshot” and assume your priorities need to be elsewhere.
Effort
We have discussed alll of the factors to this point—reach, impact, confidence—represent the numerators in the RICE scoring equation. Effort represents the denominator.In other words, if you think of RICE as a cost-benefit analysis, the other three components are all potential benefits while effort is the single score that represents the costs.Quantifying effort in this model is similar to scoring reach. You simply estimate the total number of resources (product, design, engineering, testing, etc.) needed to complete the initiative over a given period of time—typically “person-months”—and that is your score.In other words, if you estimate a project will take a total of three person-months, your effort score will be 3. (Intercom scores anything less than a month as a .5.)[cta buttontitle="Download Guide" buttonlink="https://cta-redirect.hubspot.com/cta/redirect/3434168/838edef6-19ac-4e2c-bf74-d780f3539354" buttoncolor="Purple"]Start prioritizing your roadmap[/cta]
Conclusion
The RICE scoring model can help a product team quickly create a consistent framework for objectively evaluating the relative importance or value of a number of different project ideas. If you have struggled with the other prioritization models, RICE might be worth a try in your organization.Want to learn even more? Watch the webinar on prioritization, below:

See also:Value Proposition, Product Differentiation, ICE Scoring Model, Behavioral Product Management
Your next roadmap starts here.

.svg)
.svg)