AARRR Pirate Metrics Framework
What is AARRR Pirate Metrics?
AARRR Pirate Metrics framework is an acronym for a set of five user-behavior metrics that product-led growth businesses should be tracking: acquisition, activation, retention, referral, and revenue.
Acquisition (or awareness) – How are people discovering our product or company?
Activation – Are these people taking the actions we want them to?
Retention – Are our activated users continuing to engage with the product?
Referral – Do users like the product enough to tell others about it?
Revenue – Are our personas willing to pay for this product?)
Who Created AARRR and Why?
Dave McClure, a Silicon Valley investor and founder of 500 Startups, developed the AARRR framework. McClure saw that many startup companies were easily distracted by superficial metrics, such as likes on social media.
With AARRR, McClure had a twofold goal. First, show young companies how to narrow their focus to only those metrics that can directly affect the health of their business. Second, help these companies use the right data to gauge the success of their product management and marketing efforts, then improve those initiatives that aren’t working.
Note: Because of its funny pronunciation (say it out loud), McClure also calls AARRR his “Pirate Metrics” framework. Therefore, you’ll see many product management and marketing professionals refer to it this way as well.
Here is a summarized version of McClure’s own sample AARRR metrics chart.
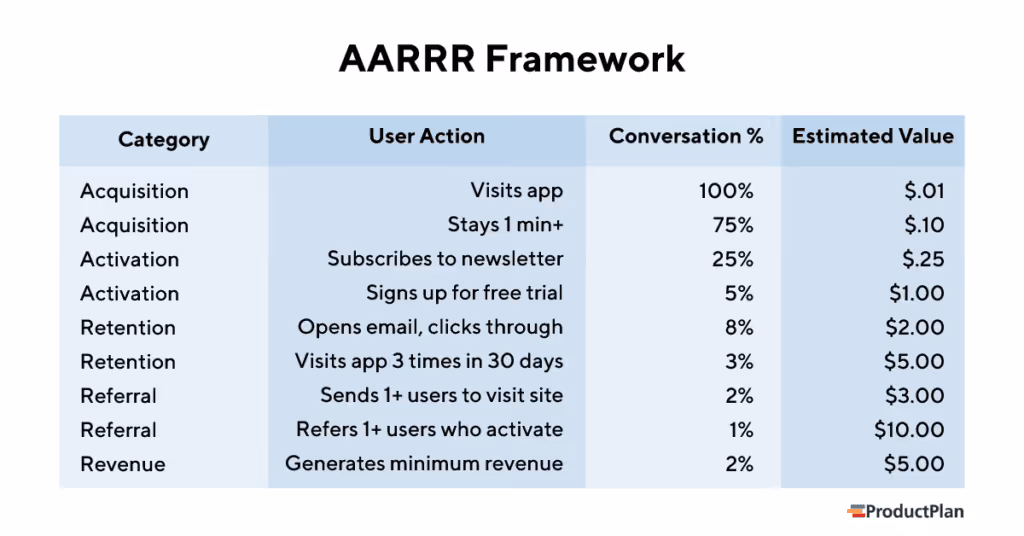
How Does the AARRR Pirate Metrics Framework Work?
Step 1: Identify your AARRR Pirate Metrics.
As McClure shows in his blog introducing the AARRR pirate metrics framework, your first step is to identify conversion metrics for each of these five user behaviors. Here are a few examples of each:
Acquisition Metrics:
In the AARRR framework, acquisition refers to all of the channels you use to introduce people to your product. This could include:
- SEO
- Social media
- Marketing campaigns
- Apps and widgets
- Advertising
Activation Metrics:
Activation refers to users taking the desired actions, or next steps, after their first encounter with your company’s product, website, or content. For example:
- Visiting additional pages
- Experimenting with additional features
- Spending a given amount of time on your site or app
- Signing up for your newsletter
- Signing up for your free trial
Retention Metrics:
After you’ve “activated” new users by persuading them to take action, you’ll want to monitor how many of these users are continuing to show interest in your product. They might do this by:
- Returning to your product repeatedly over a given timeframe
- Returning to your website
- Opening your company’s emails
- Signing up for your RSS feed
Referral Metrics:
This refers to users introducing your company or product to friends and coworkers. These are some of the most difficult metrics to track because people use all sorts of ways to tell others about apps and businesses. But you can set up tools and campaigns to track referrals, such as:
- Emails with referral promotions embedded
- Referral contests
- Other marketing campaigns designed to make it easy to share the product with others
Revenue Metrics:
Finally, you’ll need to identify actual revenue targets for your users. It will help you understand whether or not your costs for acquisition, activation, and other efforts result in profitable growth. You’ll want to know, for example, how to define users who are generating:
- Minimum revenue
- Break-even revenue
- Revenue that exceeds the customer acquisition cost.
Step 2: Set up processes to track and analyze these AARRR pirate metrics.
After you’ve identified the types of data you want to collect for each of these stages of the AARRR framework, you then need to implement tools and methods for collecting analyzing the data.
Assuming your product, app, or content is digital and online; you can use tools such as Google Analytics or KISSmetrics to capture much of this information.
Note: It’s important in this stage that your team determines an estimated dollar amount for each category of user behavior. Therefore, it will be the only way to know whether or not your product management and marketing initiatives are working in a given category.
Step 3: Run tests for all stages of user behavior to identify better approaches.
As you gather this data, McClure recommends running plenty of A/B tests to find places where you can improve user engagement at each stage of the AARRR framework.
You might run several versions of a referral contest, for example, to see which one drives the most users to tell their friends about your product. Or you might experiment with increasing your public relations output (earned media) while lowering your online ad spend (unearned media).
Step 4: Use these metrics to improve your initiatives.
Finally, as you learn what is and isn’t working at each level of your AARRR framework, you and your team can start looking for ways to adjust your product management and marketing initiatives accordingly.
Related Terms: HEART framework / lifetime value (LTV) / churn / monthly recurring revenue (MRR) / vanity metrics
Your next roadmap starts here.

.svg)